


Additional Features:
- Bandwidth: 500 MHz
- 4 Channels
- Sample Rate: 20 GS/s (1 Channel)
- Record Length: 125M (1 Channel)
- Up to 500 megapoint record length with MultiView Zoom™
- >250,000 wfms/s maximum waveform capture rate with FastAcq™
- FastFrame™ segmented memory acquisition mode with >310,000 waveforms per second capture rate
- User-selectable bandwidth limit filters for better low-frequency measurement accuracy
Ease of use features
- Pinpoint® Triggering provides the most flexible and highest performance triggering, with over 1400 combinations to address virtually any triggering situation
- Visual Trigger and Search precisely qualifies triggers and finds unique events in complex waveforms
- Advanced Search and Mark to find specific events in the entire waveform
- MyScope® custom control windows and right mouse click menus for exceptional efficiency
- 53 automated measurements, waveform histograms, and FFT analysis for simplified waveform analysis
- TekVPI® Probe Interface supports active, differential, and current probes for automatic scaling and units
- 12.1 in. (307 mm) bright XGA display with touch screen
Optional serial triggering and analysis
- Automated Serial Triggering, Decode, and Search Options for I2C, SPI, CAN, LIN, FlexRay, RS-232/422/485/UART, MIL-STD-1553, and USB 2.0
- Automated Serial Analysis Options for MIPI® D-PHY DSI-1 and CSI-2, 8b/10b, Ethernet, and PCI Express
- Clock Recovery from serial data streams
- 64-bit NRZ Serial Pattern Trigger for isolation of pattern-dependent effects up to 1.25 Gb/s
Optional technology specific analysis
- Software Solutions provide built-in domain expertise for MIPI® DPHY, Ethernet, BroadR-Reach, MOST, and USB 2.0 Compliance Testing, Jitter, Timing, Eye Diagrams, Power, DDR Memory Bus Analysis, and Wideband RF
- Limit and Mask Testing provide quick insight into signal characteristics
Connectivity
- USB Host Ports on the front and side panels for quick and easy data storage, printing, and connecting USB peripherals
- Integrated 10/100/1000BASE-T Ethernet port for network connection and Video Out port to export the oscilloscope display to a monitor or projector
- Microsoft® Windows 7 64-bit operating system for easy connectivity and integration into your environment
- LXI Class C compliant
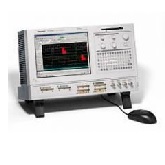
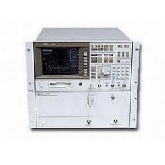
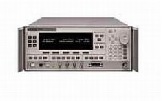
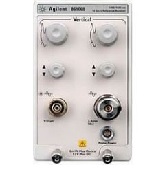
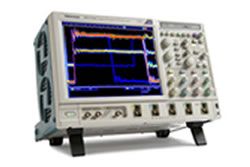
With the DPO7054C Digital Phosphor Oscilloscope, you can analyze analog and serial bus signals with a single instrument to quickly find and diagnose problems in complex designs. With a 500 MHz bandwidth and sample rates up to 20 GS/s, you can ensure you have the performance you need to see fast-changing signal details. To capture long windows of signal activity while maintaining fine timing resolution, the DPO7054C offers a deep record length of up to 125 M points standard on all channels and an optional record length of up to 500 M points on one channel.
With Advanced Search and Mark and MultiView Zoom™ features for rapid waveform navigation, and more than 15 optional software and analysis packages for common technologies and in-depth analysis tasks, the DPO7000C Series from Tektronix provides the feature-rich tools you need to simplify and speed debug of your complex design.
Comprehensive features speed every stage of debug
The DPO7000C Series offers a robust set of features to speed every stage of debugging your design – from quickly discovering an anomaly and capturing it, to searching your waveform record for the event and analyzing its characteristics and your device's behavior.
Discover
To debug a design problem, first you must know it exists. Every design engineer spends time looking for problems in their design, a timeconsuming and frustrating task without the right debug tools.
The DPO7000C Series offers the industry's most complete visualization of signals, providing fast insight into the real operation of your device. Tektronix proprietary FastAcq™ technology delivers a fast waveform capture – greater than 250,000 waveforms per second – that enables you to see glitches and other infrequent transients within seconds, revealing the true nature of device faults. A digital phosphor display with color intensity grading shows the history of a signal's activity by using color to identify areas of the signal that occur more frequently, providing a visual display of just how often anomalies occur.
Capture
Discovering a device fault is only the first step. Next, you must capture the event of interest to identify root cause.
The DPO7000C Series provides a complete set of triggers – including runt, glitch, width, timeout, transition, pattern, state, setup/hold violation, window, comm, and serial pattern – to help quickly find your event. Enhanced Triggering reduces trigger jitter at the trigger point. In this mode, the trigger point can be used as a measurement reference.
To enable complex system debug and validation, the DPO7000C Series provides Pinpoint® triggering, using Silicon Germanium (SiGe) technology to provide trigger performance up to the bandwidth of the oscilloscope and over 1400 trigger combinations. Most other trigger systems offer multiple trigger types only on a single event (A event), with the delayed trigger (B event) selection limited to edge-type triggering, and often do not provide a way to reset the trigger sequence if the B event doesn’t occur. But Pinpoint triggering provides a full suite of advanced trigger types on both A and B triggers with Reset triggering to begin the trigger sequence again after a specified time, state, or transition so that even events in the most complex signals can be captured.
Finding the right characteristic of a complex signal can require hours of collecting and sorting through thousands of acquisitions for the event of interest. Defining a trigger that isolates the desired event and shows data only when the event occurs speeds up this process. Visual Trigger and Search makes the identification of the desired waveform events quick and easy by scanning through all waveform acquisitions and comparing them to on-screen areas (geometric shapes).
With up to a 500 M point record length, you can capture many events of interest, even thousands of serial packets, in a single acquisition for further analysis while maintaining high resolution to zoom in on fine signal details. Investigate multiple segments of your waveform capture simultaneously with MultiView Zoom™ to quickly compare events in real time. FastFrame™ Segmented Memory mode enables you to make efficient use of large records by capturing many trigger events in a single record eliminating large time gaps between events of interest. View and measure the segments individually or as an overlay.
From triggering on specific packet content to automatic decode in multiple data formats, the DPO7000C Series provides integrated support for a broad range of serial buses – I2C, SPI, CAN, LIN, FlexRay, RS-232/422/485/UART, MIL-STD-1553, Ethernet, USB 2.0, and MIPI DPHY. The ability to decode up to 16 serial buses simultaneously means you gain insight into system-level problems quickly.
Search
Finding your event of interest in a long waveform record can be time consuming without the right search tools. With today's record lengths pushing beyond a million data points, locating your event can mean scrolling through thousands of screens of signal activity.
The DPO7000C Series offers the industry's most comprehensive search and waveform navigation with the standard Advanced Search and Mark feature and front-panel controls. User marks allow you to mark any location that you may want to reference later for further investigation. Or, automatically search your entire record for the criteria you define. Along the way it will automatically mark every occurrence of your defined event so you can quickly move between events. The advanced search and mark capability of the DPO7000C Series can search for up to eight different events simultaneously and stop a live acquisition when it finds an event of interest, saving even more time.
Analyze
Verifying that your prototype's performance matches simulations and meets the project's design goals requires analyzing its behavior. Tasks can range from simple checks of rise times and pulse widths to sophisticated power loss analysis, characterization of system clocks, and investigation of noise sources. The DPO7000C Series offers a comprehensive set of integrated analysis tools including waveform- and screen-based cursors, 53 automated measurements, advanced waveform math including arbitrary equation editing, custom MATLAB and .NET math plug-in analysis functions, waveform histograms, and FFT analysis.
Every DPO7000C Series oscilloscope includes the DPOJET Essentials jitter and eye pattern analysis software package, extending the oscilloscope's measurement capabilities to take measurements over contiguous clock and data cycles in a single-shot real-time acquisition. This enables measurement of key jitter and timing analysis parameters such as Time Interval Error and Phase Noise to help characterize possible system timing issues. Analysis tools such as plots for time trends and histograms quickly show how timing parameters change over time, and spectrum analysis quickly shows the precise frequency and amplitude of jitter and modulation sources.
Specialized application support for serial bus debug and compliance test, jitter and eye pattern analysis, power supply design, limit and mask testing, DDR memory bus analysis, and wideband RF is also available.
| Manufacturer | Tektronix |
|---|---|
| Condition | Used |
| Channels | 4 |
| Frequency | 500 MHz |
| Record Length | 125 MPts |
| Sampling Rate | 20 GS/s |