
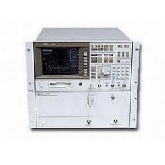


Additional Features:
- 1 GHz bandwidth
- 2 GS/s sample rate
- Max. 8 bit vertical resolution
- 32K record length
- Over 24 waveform functions and 24 automatic measurements
- 3.5" floppy, Centronics, RS-232 and GPIB interfaces
- Color display
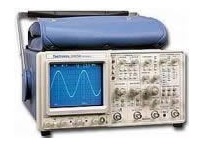
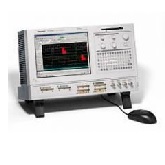
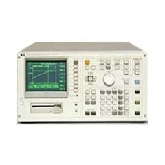
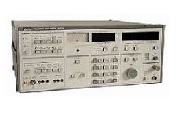
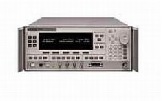
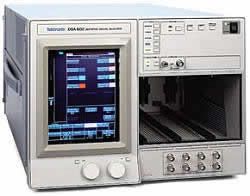
The Tektronix DSA602A oscilloscope is a graph-displaying device – it draws a graph of an electrical signal. In most applications, the graph shows how signals change over time: the vertical (Y) axis represents voltage and the horizontal (X) axis represents time. The intensity or brightness of the display is sometimes called the Z axis.
The Tektronix DSA602A oscilloscope's simple graph can tell you many things about a signal, such as: the time and voltage values of a signal, the frequency of an oscillating signal, the “moving parts” of a circuit represented by the signal, the frequency with which a particular portion of the signal is occurring relative to, other portions, whether or not a malfunctioning component is distorting the signal, how much of a signal is direct current (DC) or alternating current (AC) and how much of the signal is noise and whether the noise is changing with time.
| Manufacturer | Tektronix |
|---|---|
| Condition | Used |
| Frequency | 1 GHz |