Spectral values
Level
Processing
Interfaces
General data
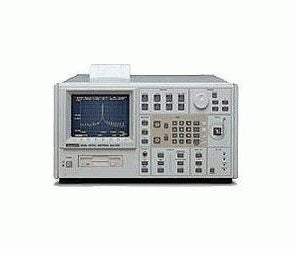
The Advantest Q8383 is a high-grade spectrum analyzer with double-pass monochromator and extremely low polarization dependence. Thanks to a special method used, a value of ±0.05 dB can be guaranteed, the typical value is as low as 0.02 dB.
Together with the high accuracy of the resolution bandwidth, the Q8383 can be used to perform accurate power measurements.
All these features make the Q8383 an ideal measuring instrument for erbiumdoped fiber amplifiers (EDFA). A special measurement function allows determination of noise figure, gain and spontaneous emission by simple comparison of the signal at the amplifier input with the signal at the amplifier output. All these features are of course also of great advantage for the measurement of laser diodes, LEDs and other light sources. A curve fitting function directly shows the electroluminescence characteristic by fitting a Gaussian distribution into the emission spectrum. This is a valuable aid in the measurement of erbium- doped fiber amplifiers (EDFA) and LDs. Special functions for pulsed light allow measurements of fiber rings and Soliton transmission systems. Internal or external triggering is possible.
The measurement time is 0.8 second for a span of 200 nm and varies as a function of the span. The highest sensitivity is attained for wideband sources with a resolution of 5 nm, while narrowband sources (laser) can reliably be analyzed down to the noise level even with narrow resolution bandwidths. A normalization function in conjunction with a white light source enables direct measurement of the transmission and loss characteristics of optical filters and fibers.
In addition to the amplifier analysis, the versatile display modes such as overlay display, comparison with memory contents, display of two separate diagrams (split screen), power meter function, use of several markers, normalization and direct readout of transmission loss as well as automatic bandwidth analysis (e.g. half-value width measurement to RMS and envelope method), curve fitting and many other features facilitate operation of the analyzer and simplify analysis via IEC/IEEE bus.
The standard built-in disk drive is used as a storage medium. The stored binary data can be analyzed with an appropriate program under MS-Windows, copied into documents and printed. The high-speed built-in thermal printer provides a hardcopy of the measurement results with all setting parameters within 8 seconds.
Model No
Q8383
Condition
Used
Manufacturer
Advantest
30+ Years in Business
Secure Payments
Sell Test Equipments
Knowledgeable Staff
On-site Lab
30+ Years in Business
Secure Payments
Sell Test Equipments
Knowledgeable Staff
On-site Lab
Hey👋Let's start with your email
 Chat Live
 Contact Us
 sales@valuetronics.com